Figure 8.1 shows that business cycle peaks and troughs are identified with peaks and troughs in the
Question:
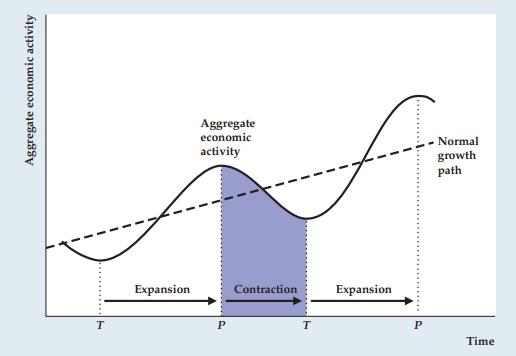
Figure 8.1 shows that business cycle peaks and troughs are identified with peaks and troughs in the level of aggregate economic activity, which is consistent with current NBER methodology. However, for business cycles before 1927, the NBER identified business cycle peaks and troughs with peaks and troughs in detrended aggregate economic activity (aggregate economic activity minus the “normal growth path” shown in Fig. 8.1). Show that this alternative methodology implies that peaks occur earlier and that troughs occur later than you would find when using the current methodology. Compared to the current methodology, does the alternative methodology increase or decrease the computed length of contractions and expansions?
How might this change in measurement account for the differences in the average measured lengths of expansions and contractions since World War II compared to the period before World War I?
Figure 8.1
Step by Step Answer: