

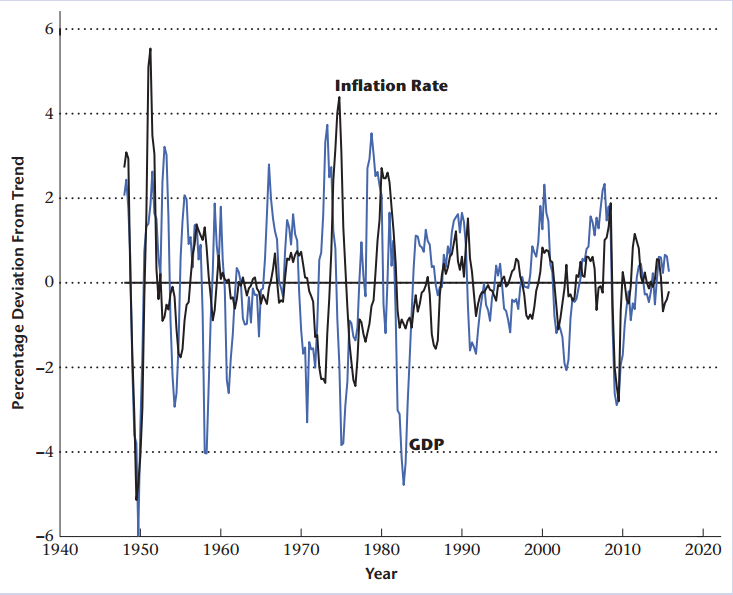
In Figure 3.12, what do you observe during the 1970s? Explain the significance of this. Figure 3.12:
Question:
Figure 3.12:
Fantastic news! We've Found the answer you've been seeking!
Step by Step Answer:
In Figure 312 during the 1970s it appears that the inflatio...View the full answer

Answered By
Brown Arianne
Detail-oriented professional tutor with a solid 10 years of experience instilling confidence in high school and college students. Dedicated to empowering all students with constructive feedback and practical test-taking strategies. Effective educator and team player whether working in a school, university, or private provider setting. Active listener committed to helping students overcome academic challenges to reach personal goals.
2+ Reviews
10+ Question Solved
Related Book For 
Question Posted:
