

The accompanying diagram shows Canadian-owned assets abroad and foreign-owned assets in Canada, both as a percentage of
Question:
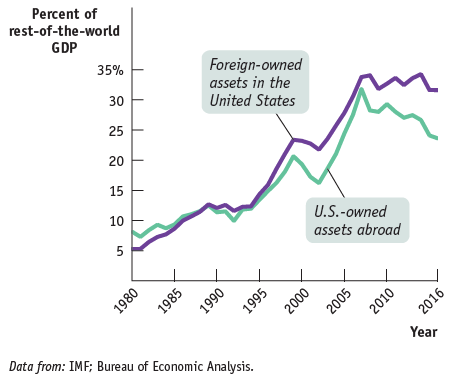
a. Since Canadian-owned assets abroad increased as a percentage of GDP, does this mean that Canada, over the period, experienced net capital outflows?
b. Compare the net capital flows in in the early 1980s to the net capital flows in the late 2000s. Did the net capital flows increase or decrease? Why?
Fantastic news! We've Found the answer you've been seeking!
Step by Step Answer:
a Yes the diagram indicates that Canada experienced net capita...View the full answer

Answered By
Fahmin Arakkal
Tutoring and Contributing expert question and answers to teachers and students.
Primarily oversees the Heat and Mass Transfer contents presented on websites and blogs.
Responsible for Creating, Editing, Updating all contents related Chemical Engineering in
latex language
8+ Reviews
22+ Question Solved
Related Book For 

Macroeconomics
ISBN: 978-1319120054
3rd Canadian edition
Authors: Paul Krugman, Robin Wells, Iris Au, Jack Parkinson
Question Posted:
