

The accompanying diagram shows the inflation rate in Canada from 1980 to 2017. a. From 1980 to
Question:
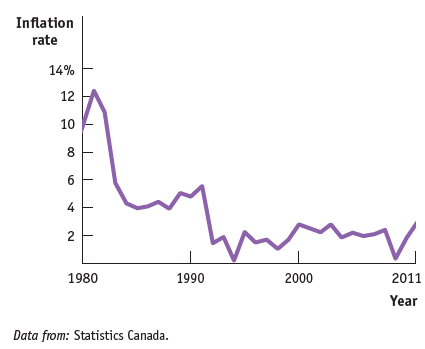
a. From 1980 to 2017, Canada experienced two periods of disinflation€”the first between 1980 and 1985 and the second between 1991 and 1994. How would you have expected the unemployment rate to behave during these two periods?
b. Nowadays, policy makers react forcefully when the inflation rate rises above a target rate of 2%. Why would it be harmful if inflation rose from 1.8% (the level in 2010) to, say, a level of 5%?
Fantastic news! We've Found the answer you've been seeking!
Step by Step Answer:
a We should expect That the unemployment rate would rise ...View the full answer

Answered By
David Muchemi
I am a professional academic writer with considerable experience in writing business and economic related papers. I have been writing for my clients who reach out to me personally after being recommended to me by satisfied clients.
I have the English language prowess, no grammatical and spelling errors can be found in my work. I double-check for such mistakes before submitting my papers.
I deliver finished work within the stipulated time and without fail. I am a good researcher on any topic especially those perceived to be tough.
I am ready to work on your papers and ensure you receive the highest quality you are looking for. Please hire me to offer my readily available quality service.
Best regards,
27+ Reviews
61+ Question Solved
Related Book For 

Macroeconomics
ISBN: 978-1319120054
3rd Canadian edition
Authors: Paul Krugman, Robin Wells, Iris Au, Jack Parkinson
Question Posted:
