

The accompanying table gives the annual Canadian demand and supply schedules for pickup trucks. a. Plot the
Question:
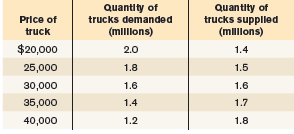
a. Plot the demand and supply curves using these schedules. Indicate the equilibrium price and quantity on your diagram.
b. Suppose the tires used on pickup trucks are found to be defective. What would you expect to happen in the market for pickup trucks? Show this on your diagram.
c. Suppose that Transport Canada imposes costly regulations on manufacturers that cause them to reduce supply by one-third at any given price. Calculate and plot the new supply schedule and indicate the new equilibrium price and quantity on your diagram.
Fantastic news! We've Found the answer you've been seeking!
Step by Step Answer:
a The supply curve is S 1 and the demand curve is D 1 The equilibrium in the market for pickup truck...View the full answer

Answered By
Mugdha Sisodiya
My self Mugdha Sisodiya from Chhattisgarh India. I have completed my Bachelors degree in 2015 and My Master in Commerce degree in 2016. I am having expertise in Management, Cost and Finance Accounts. Further I have completed my Chartered Accountant and working as a Professional.
Since 2012 I am providing home tutions.
2+ Reviews
10+ Question Solved
Related Book For 

Macroeconomics
ISBN: 978-1319120054
3rd Canadian edition
Authors: Paul Krugman, Robin Wells, Iris Au, Jack Parkinson
Question Posted:
