

The accompanying table illustrates annual salaries and income tax owed by five individuals. Apart from the fact
Question:
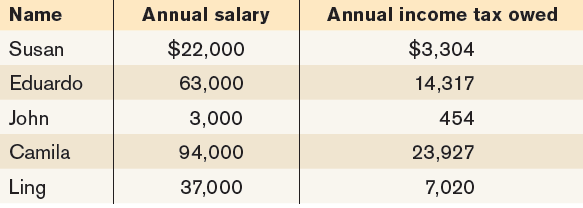
a. If you were to plot these points on a graph, what would be the average slope of the curve between the points for Eduardo€™s and Camila€™s salaries and taxes using the arc method? How would you interpret this value for slope?
b. What is the average slope of the curve between the points for John€™s and Susan€™s salaries and taxes using the are method? How would you interpret that value for slope?
c. What happens to the slope as salary increases? What does this relationship imply about how the level of income taxes affects a person€™s incentive to earn a higher salary?
Fantastic news! We've Found the answer you've been seeking!
Step by Step Answer:
a Annual salary is the independent variable and so is measured on the horizontal axis Annual income ...View the full answer

Answered By
Vikash Gupta
I am graduated in Physics in 2018, from KIRORIMAL COLLEGE, University of Delhi. Now I am persuing Master's degree in physics. I like to do physics problems. I have experience of 1 year in tutoring. I think Physics is the only subject where you understand things,how they are happening . In physics you learn Maths and apply it. So I would like to join your platform to solve many Physics problems.
5+ Reviews
10+ Question Solved
Related Book For 

Macroeconomics
ISBN: 978-1319120054
3rd Canadian edition
Authors: Paul Krugman, Robin Wells, Iris Au, Jack Parkinson
Question Posted:
