

Question: The accompanying table provides data from Canada on the average annual rates of unemployment and inflation rate. Use the numbers to construct a scatter plot
The accompanying table provides data from Canada on the average annual rates of unemployment and inflation rate. Use the numbers to construct a scatter plot similar to Figure 16-5. Discuss why, in the short run, the unemployment rate rises when inflation falls.
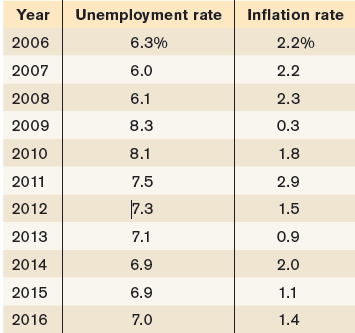
Year Unemployment rate Inflation rate 2006 6.3% 2.2% 2007 6.0 2.2 2.3 2008 6.1 2009 8.3 0.3 2010 8.1 1.8 2011 7.5 2.9 7.3 1.5 2012 0.9 2013 7.1 2014 6.9 2.0 2015 6.9 1.1 2016 7.0 1.4
Step by Step Solution
3.41 Rating (160 Votes )
There are 3 Steps involved in it
The accompanying figure shows a negative relationship between the u... View full answer

Get step-by-step solutions from verified subject matter experts