

The accompanying table shows data from the World Bank, World Development Indicators, for real GDP per capita
Question:
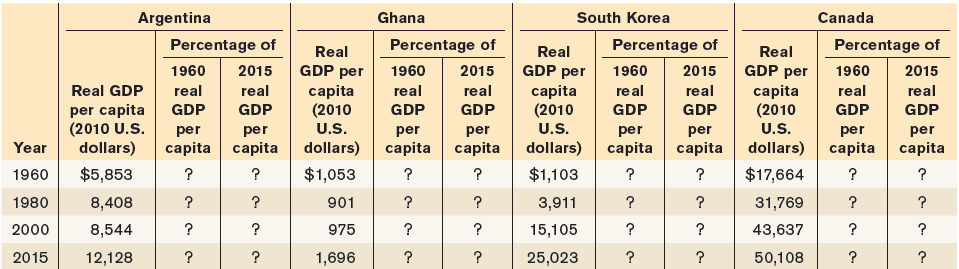
a. Complete the table by expressing each year€™s real GDP per capita as a percentage of its 1960 and 2015 levels.
b. How does the growth in living standards from 1960 to 2015 compare across these four nations? What might account for these differences?
Fantastic news! We've Found the answer you've been seeking!
Step by Step Answer:
a The following table shows the results of the exercises in division required by the question b Sout...View the full answer

Answered By
John Aketch
I am a dedicated person with high degree of professionalism, particularly in academic writing. My desire is to is to make students excel in their academic endeavor.
3+ Reviews
10+ Question Solved
Related Book For 

Macroeconomics
ISBN: 978-1319120054
3rd Canadian edition
Authors: Paul Krugman, Robin Wells, Iris Au, Jack Parkinson
Question Posted:
