

The accompanying table shows how consumers marginal propensities to consume in a particular economy are related to
Question:
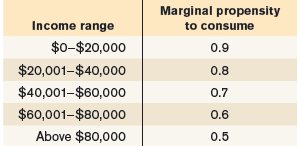
a. Suppose the government engages in increased purchases of goods and services. For each of the income groups in the table, what is the value of the multiplier-that is, what is the "bang for the buck" from each dollar the government spends on government purchases of goods and services in each income group?
b. If the government needed to close a recessionary or inflationary gap, at which group should it primarily aim its fiscal policy of changes in government purchases of goods and services?
Fantastic news! We've Found the answer you've been seeking!
Step by Step Answer:
a The accompanying table shows the bang for the buck for ...View the full answer

Answered By
Utsab mitra
I have the expertise to deliver these subjects to college and higher-level students. The services would involve only solving assignments, homework help, and others.
I have experience in delivering these subjects for the last 6 years on a freelancing basis in different companies around the globe. I am CMA certified and CGMA UK. I have professional experience of 18 years in the industry involved in the manufacturing company and IT implementation experience of over 12 years.
I have delivered this help to students effortlessly, which is essential to give the students a good grade in their studies.
2+ Reviews
10+ Question Solved
Related Book For 

Macroeconomics
ISBN: 978-1319120054
3rd Canadian edition
Authors: Paul Krugman, Robin Wells, Iris Au, Jack Parkinson
Question Posted:
