

The accompanying table shows the annual growth rate for the years 20002014 in per capita emissions of
Question:
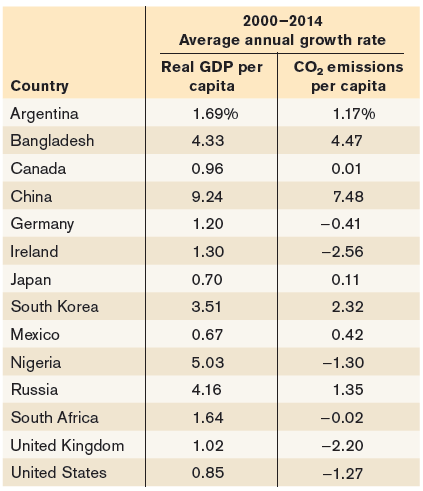
Data from: Energy Information Administration; World Bank.
a. Rank the countries in terms of their growth in CO2 emissions, from highest to lowest. What five countries have the highest growth rate in emissions? What five countries have the lowest growth rate in emissions?
b. Now rank the countries in terms of their growth in real GDP per capita, from highest to lowest. What five countries have the highest growth rate? What five countries have the lowest growth rate?
c. Would you infer from your results that CO2 emissions are linked to growth in output per capita?
d. Do high growth rates necessarily lead to high CO2 emissions?
Fantastic news! We've Found the answer you've been seeking!
Step by Step Answer:
a As shown in the accompanying table the five countries with the highest growth rate in per capita C...View the full answer

Answered By
Tobias sifuna
I am an individual who possesses a unique set of skills and qualities that make me well-suited for content and academic writing. I have a strong writing ability, allowing me to communicate ideas and arguments in a clear, concise, and effective manner. My writing is backed by extensive research skills, enabling me to gather information from credible sources to support my arguments. I also have critical thinking skills, which allow me to analyze information, draw informed conclusions, and present my arguments in a logical and convincing manner. Additionally, I have an eye for detail and the ability to carefully proofread my work, ensuring that it is free of errors and that all sources are properly cited. Time management skills are another key strength that allow me to meet deadlines and prioritize tasks effectively. Communication skills, including the ability to collaborate with others, including editors, peer reviewers, and subject matter experts, are also important qualities that I have. I am also adaptable, capable of writing on a variety of topics and adjusting my writing style and tone to meet the needs of different audiences and projects. Lastly, I am driven by a passion for writing, which continually drives me to improve my skills and produce high-quality work.
1+ Reviews
10+ Question Solved
Related Book For 

Macroeconomics
ISBN: 978-1319120054
3rd Canadian edition
Authors: Paul Krugman, Robin Wells, Iris Au, Jack Parkinson
Question Posted:
