The Consumer Price Index The Consumer Price Index represents the average price of goods that households consume.
Question:
The Consumer Price Index The Consumer Price Index represents the average price of goods that households consume. Many thousands of goods are included in such an index. Here consumers are represented as buying only food (pizza) and gas as their basket of goods. Here is a representation of the kind of data the Bureau of Economic Analysis collects to construct a consumer price index. In the base year, 2012, both the prices of goods purchased and the quantity of goods purchased are collected. In subsequent years, only prices are collected. Each year, the agency collects the price of that good and constructs an index of prices that represents two exactly equivalent concepts:
How much more money does it take to buy the same basket of goods in the current year than in the base year? How much has the purchasing power of money declined, measured in baskets of goods, in the current year, from the base year?
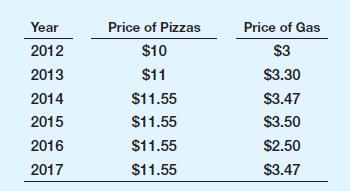
The data: In an average week in 2012, the Bureau of Economic Analysis surveys many consumers and determines that the average consumer purchases 2 pizzas and 6 gallons of gas in a week. The prices per pizza and per gallon in subsequent years are shown below.
a. What is the cost of the consumer price basket in 2012?
b. What is the cost of the consumer price basket in 2013 and in subsequent years?
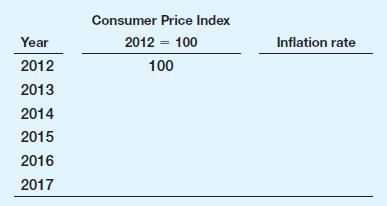
c. Represent the annual cost of the consumer price basket as an index number. Set the value of the index number equal to 100 in 2012.
d. Calculate the annual rate of inflation using the percent change in the value of the index number between each year from 2013 on.
e. Is there a year in which inflation is negative? Why does this happen?
f. What is the source of inflation in the year 2015? How is that different from inflation in 2013 and 2014?
g. How many baskets of goods can I buy with $100 in 2012? How many baskets can I buy with that money in 2017? What is the percentage decline in the purchasing power of my money? How does that decline relate to the change in the value of the price index between 2012 and 2017?
h. From 2013 to 2015, the price of a pizza remains the same.
The price of gas rises. How might consumers respond to such a change? In 2016, the price of gas falls. What are the implications of such changes in relative prices for the construction of the Consumer Price Index?
i. Suppose the Bureau of Economic Analysis determines that in 2017, the average consumer buys 2 pizzas and 7 gallons of gas in a week. Use a spreadsheet to calculate the Consumer Price Index set equal to 100 in 2017 and use the 2017 basket in the years from 2012 to 2017. Fill in the table below:
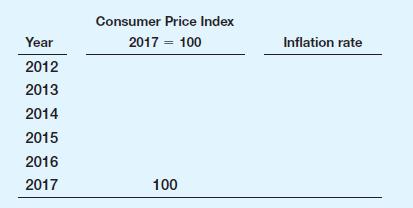
Why are the inflation rates (slightly) different in part d and part i?
Step by Step Answer: