

Question: Use the information in the table from problem 4 to draw the marginal cost curve and the average total cost curve for the first 5
Use the information in the table from problem 4 to draw the marginal cost curve and the average total cost curve for the first 5 loaves made by the Island Bakery. If you were to continue these curves for larger quantities of loaves, what can you say about where the two curves would cross?
Table from problem 4
The following table provides cost information for the first 5 loaves of bread produced by the Island Bakery. Fill in the missing values.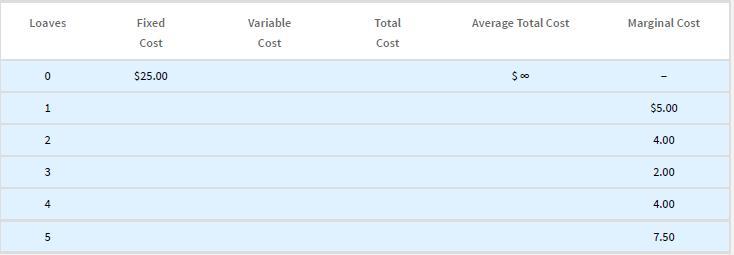
Loaves 0 1 2 3 4 5 Fixed Cost $25.00 Variable Cost Total Cost Average Total Cost $00 Marginal Cost $5.00 4.00 2.00 4.00 7.50
Step by Step Solution
3.54 Rating (168 Votes )
There are 3 Steps involved in it

Get step-by-step solutions from verified subject matter experts