Using the IS-MP diagram and the Phillips curve, explain how the productivity slowdown of the 1970s may
Question:
Using the IS-MP diagram and the Phillips curve, explain how the productivity slowdown of the 1970s may have contributed to the Great Inflation. In particular, answer the following:
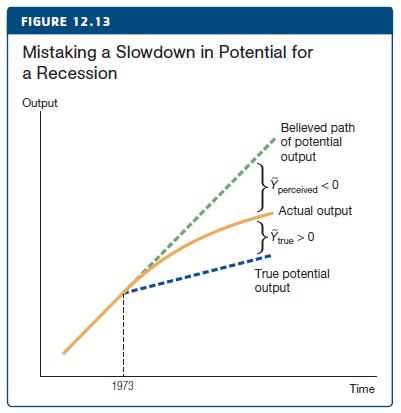
(a) Suppose growth in actual output is slowing down, as shown in Figure 12.13. Policymakers believe this is occurring because of a negative shock to aggregate demand. Explain how such a shock would account for the slowdown using an IS-MP diagram.
(b) With this belief, what monetary policy action would policymakers take to stabilize the economy? Show this in the IS-MP diagram, as perceived by policymakers.
(c) In truth, there was a slowdown in potential output, as also shown in Figure 12.13. Show the effect of monetary policy on short-run output in the “true” IS-MP diagram.
(d) Show the effect of this monetary policy in a graph of the Phillips curve. Explain what happens.
(e) How will policymakers from parts (a) and (b) know they have made a mistake?
Step by Step Answer:
ANSWER a A negative shock to aggregate demand such as a decrease in consumer or investment spending would cause a leftward shift in the IS curve in th...View the full answer