

Question: 4. Construct a table from the data shown in the accompanying graph. Which is the dependent variable and which is the independent variable? Summarize the
4. Construct a table from the data shown in the accompanying graph. Which is the dependent variable and which is the independent variable? Summarize the data in equation form. LO1.8
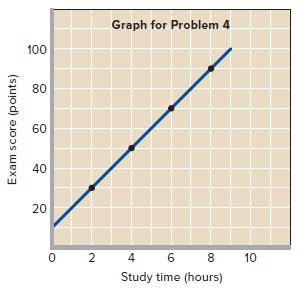
100 Graph for Problem 4 80 Exam score (points) 60 69 40 20 20 02 4 6 8 10 Study time (hours)
Step by Step Solution
There are 3 Steps involved in it
1 Expert Approved Answer
Step: 1 Unlock

Question Has Been Solved by an Expert!
Get step-by-step solutions from verified subject matter experts
Step: 2 Unlock
Step: 3 Unlock