

Figure 3.1 illustrates the market for bread. a. Label the curves in the figure. b. What are
Question:
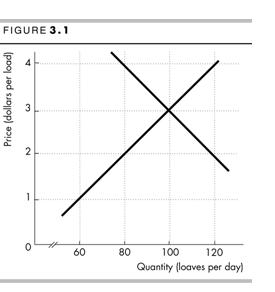
Figure 3.1 illustrates the market for bread.
a. Label the curves in the figure.
b. What are the equilibrium price of bread and the equilibrium quantity of bread?
Fantastic news! We've Found the answer you've been seeking!
Step by Step Answer:
a The demand curve is the curve that slopes down toward to th...View the full answer

Answered By
Junaid ahmed
I am an English language professor with years of experience In Teaching English Language and Literature. I like to help people in the various difficult matter.
2+ Reviews
10+ Question Solved
Related Book For 

Question Posted:
