

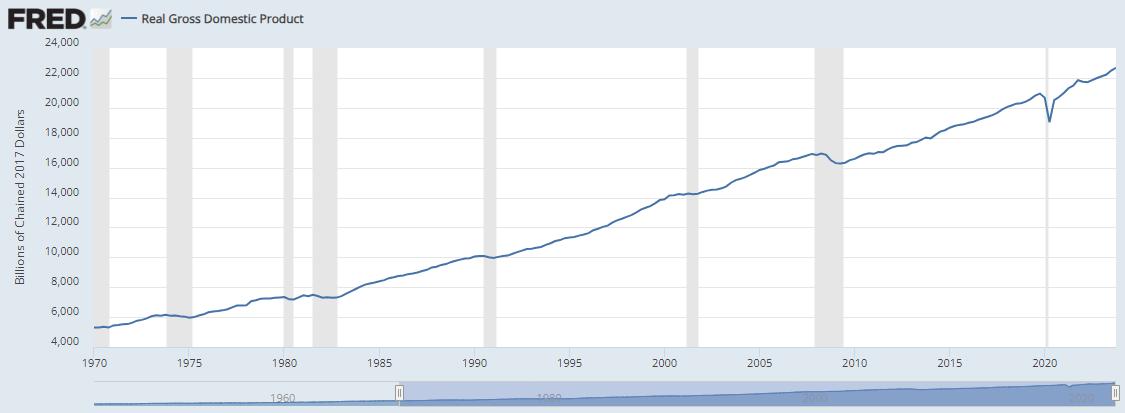
Plot a graph of quarterly data for real GDP and full-employment GDP from 1970 to the present.
Question:
Plot a graph of quarterly data for real GDP and full-employment GDP from 1970 to the present. (In the FRED database, full-employment GDP is called Real Potential GDP, FRED variable GDPPOT.) Which variable is “smoother”? How would you characterize the volatility of real GDP before 1980 compared with after 1980? From 1950 to 2010, how would you characterize the overall movements in the growth rate of real full-employment GDP?
Real Gross Domestic Product:
Step by Step Answer:

This question has not been answered yet.
You can Ask your question!
Related Book For 

Macroeconomics
ISBN: 9780134167398
9th Edition
Authors: Andrew B. Abel, Ben Bernanke, Dean Croushore
Question Posted:
