

Question: Below are selected ratios for three years ending March 31 for the Worst Company Ltd: Outline possible explanations for the drastic changes in some of
Below are selected ratios for three years ending March 31 for the Worst Company Ltd: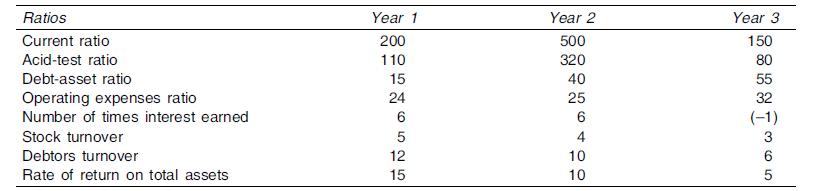
Outline possible explanations for the drastic changes in some of the ratios during these years.
Ratios Current ratio Acid-test ratio Debt-asset ratio Operating expenses ratio Number of times interest earned Stock turnover Debtors turnover Rate of return on total assets Year 1 200 110 15 24 6 5 12 15 Year 2 500 320 40 25 6 4 10 10 Year 3 150 80 55 32 3 6 5
Step by Step Solution
3.50 Rating (157 Votes )
There are 3 Steps involved in it
The reasons for the drastic changes may be conceived i... View full answer

Get step-by-step solutions from verified subject matter experts