

Question: E6-29A Regression analysis using Excel output (Learning Objective 5) Assume that Lipton performs a regression analysis on the next years data using Excel. The output
E6-29A Regression analysis using Excel output (Learning Objective 5)
Assume that Lipton performs a regression analysis on the next year’s data using Excel.
The output generated by Excel is as follows:
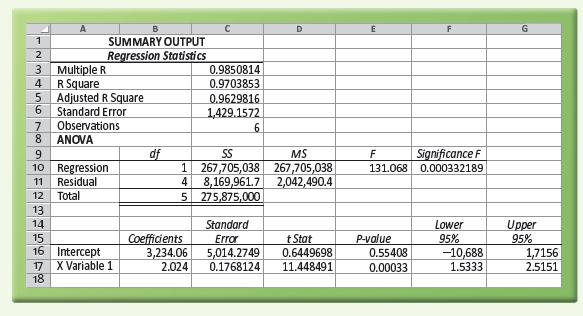
Requirements 1. Indicate the firm’s fixed cost.
2. Indicate the variable cost per unit.
3. Determine the cost equation (use the output from the Excel regression).
2345678 ROULEURSTO 1 A Multiple R R Square B SUMMARY OUTPUT Regression Statistics 5 Adjusted R Square Standard Error Observations ANOVA D E F G 9 df 10 Regression 0.9850814 0.9703853 0.9629816 1,429.1572 6 SS MS F 1 267,705,038 267,705,038 131.068 Significance F 0.000332189 11 Residual 4 8,169,961.7 2,042,490.4 12 Total 5 275,875,000 13 14 15 Coefficients 16 Intercept 3,234.06 Standard Error 5,014.2749 t Stat P-value 0.6449698 0.55408 Lower 95% -10,688 Upper 95% 17 X Variable 1 2.024 0.1768124 11.448491 0.00033 1.5333 1,7156 2.5151 18
Step by Step Solution
There are 3 Steps involved in it

Get step-by-step solutions from verified subject matter experts