

Question: E6-47B Continuation of E6-45B: Regression analysis (Learning Objective 5) Refer to the Posies Unlimited data in E6-45B. Use Microsoft Excel to run a regression analysis,
E6-47B Continuation of E6-45B: Regression analysis (Learning Objective 5)
Refer to the Posies Unlimited data in E6-45B. Use Microsoft Excel to run a regression analysis, then do the following calculations.
Requirements 1. Determine the firm’s cost equation (use the output from the Excel regression).
2. Determine the R-square (use the output from the Excel regression). What does Posies Unlimited’s R-square indicate?
3. Predict van operating costs at a volume of 17,000 miles.
E6-48B Regression analysis using Excel output (Learning Objective 5)
The regression analysis report was generated using Excel for Epson as follows:
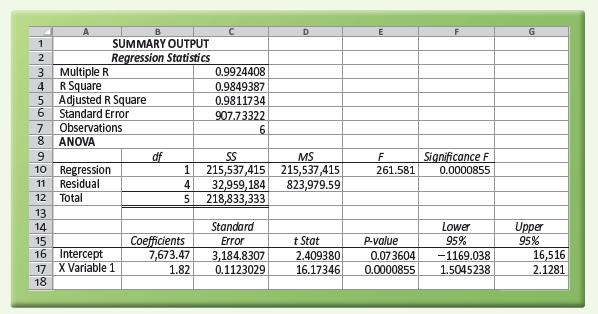
Requirements 1. Indicate the firm’s fixed cost.
2. Indicate the variable cost per unit.
3. Determine the cost equation (use the output from the Excel regression).
D G 1 2 SUMMARY OUTPUT Regression Statistics 3 Multiple R 4 R Square 5 Adjusted R Square 6 Standard Error 0.9924408 0.9849387 0.9811734 907.73322 18 7809UU2345678 Observations ANOVA 10 Regression 6 df SS 1 215,537,415 MS 215,537,415 F 261.581 Significance F 0.0000855 11 Residual 12 Total 4 32,959,184 823,979.59 5 218,833,333 13 14 Standard 15 Coefficients Error t Stat P-value Lower 95% Upper 95% 16 Intercept 7,673.47 3,184.8307 2.409380 0.073604 -1169.038 16,516 17 X Variable 1 1.82 0.1123029 16.17346 0.0000855 1.5045238 2.1281
Step by Step Solution
There are 3 Steps involved in it

Get step-by-step solutions from verified subject matter experts