

Question: S6-11 Analyze a scatter plot (Learning Objectives 3 & 4) The local Holiday Inn collected seven months of data on the number of room-nights rented
S6-11 Analyze a scatter plot (Learning Objectives 3 & 4)
The local Holiday Inn collected seven months of data on the number of room-nights rented per month and the monthly utilities cost. The data were graphed, resulting in the following scatter plot:
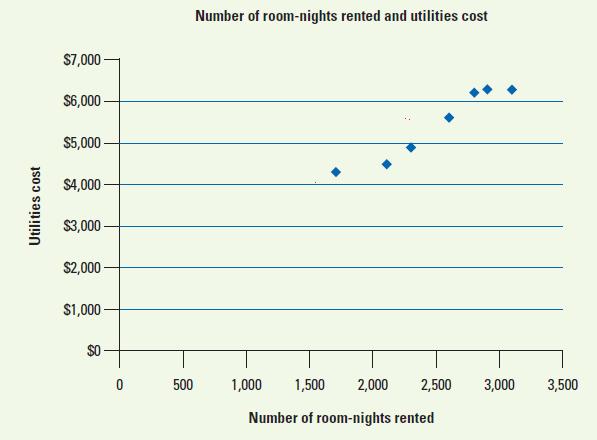
1. Based on this scatter plot, how strong of a relationship does there appear to be between the number of room-nights rented per month and the monthly utilities cost?
2. Do there appear to be any outliers in the data? Explain.
3. Suppose management performs the high-low method using this data. Do you think the resulting cost equation would be very accurate? Explain.
Utilities cost $7,000 $6,000- $5,000- $4,000 $3,000- $2,000 $1,000- Number of room-nights rented and utilities cost $0 0 500 1,000 1,500 2,000 2,500 3,000 3,500 Number of room-nights rented
Step by Step Solution
There are 3 Steps involved in it

Get step-by-step solutions from verified subject matter experts