Employees at stores owned by the nationwide Kelley Grocery chain frequently hand out free samples of new
Question:
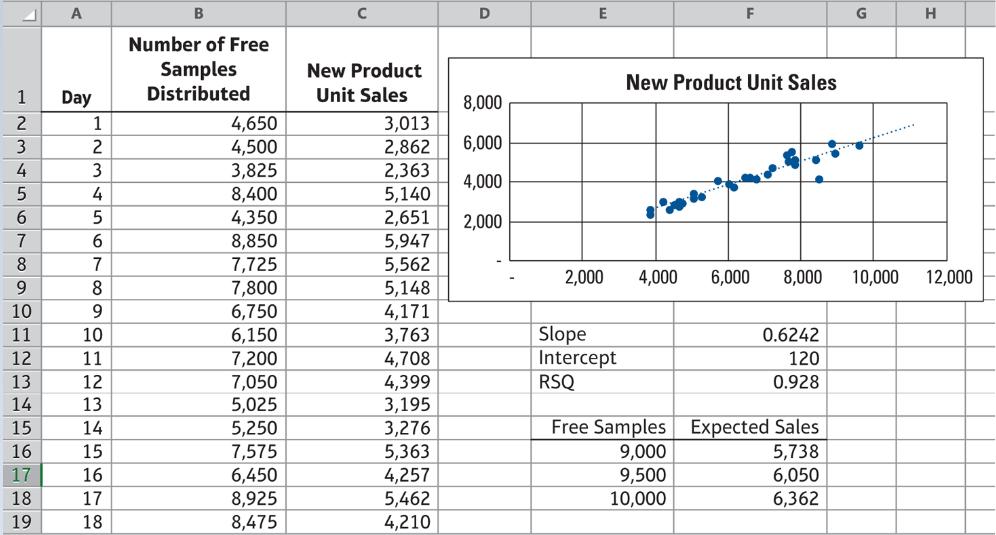
Employees at stores owned by the nationwide Kelley Grocery chain frequently hand out free samples of new food products to entice shoppers to purchase new products. Sometimes the free sample distribution leads to stockouts of the product if management has not adequately predicted the demand for the new product. Other times, the chain is left with excess inventory of the new product. Management suspects that the number of free samples distributed can help to predict sales of the new products. The controller at Kelley’s headquarters has gathered data on the free sample distributions and related new product sales at all Kelley stores for the past 60 days. The controller used Excel to analyze the data using a scatterplot with a trendline and the FORECAST.LINEAR function. An excerpt from that analysis follows.
Requirement
1. In this data set, what field is the predictor variable (x)? What field is the outcome variable (y)?
2. Explain the steps you would take to create the following items in the analysis by the Kelley controller:
a. The scatterplot with trendline
b. The results from the FORECAST.LINEAR function
3. Does it appear that the number of free samples distributed will be a good predictor of sales of new products? What are two ways that you can tell?
4. How many units of a new product could Kelley expect to sell if it distributed 9,500 free samples of that new product?
5. Which cell(s) would you change in the Excel worksheet to predict how many units of new product would be sold if there were 10,100 free samples distributed?
Step by Step Answer:
ANSWER 1 The predictor variable x in this data set is the number of free samples distributed and the ...View the full answer