

Question: Name the following chart, and identify the items represented by the letters (a) through (f). Sales and Costs $200,000 $150,000 $100,000 $50,000 a 10,000 20,000
Name the following chart, and identify the items represented by the letters (a) through (f).
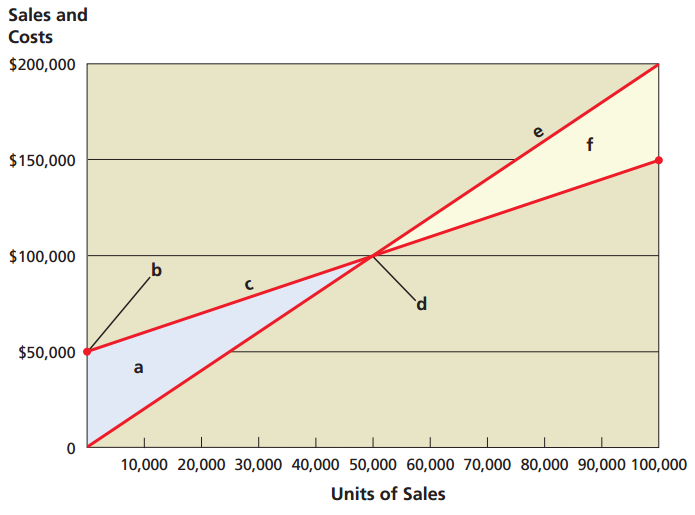
Sales and Costs $200,000 $150,000 $100,000 $50,000 a 10,000 20,000 30,000 40,000 50,000 60,000 70,000 80,000 90,000 100,000 Units of Sales
Step by Step Solution
★★★★★
3.37 Rating (163 Votes )
There are 3 Steps involved in it
1 Expert Approved Answer
Step: 1 Unlock

Costvolumeprofit chart a ... View full answer
Question Has Been Solved by an Expert!
Get step-by-step solutions from verified subject matter experts
Step: 2 Unlock
Step: 3 Unlock
Document Format (2 attachments)
1737_60b75c5429e27_707944.pdf
180 KBs PDF File
1737_60b75c5429e27_707944.docx
120 KBs Word File