

Question: Using the data provided in E6-55B, the laboratory manager performed a regression analysis to predict total laboratory overhead costs. The output generated by Excel is
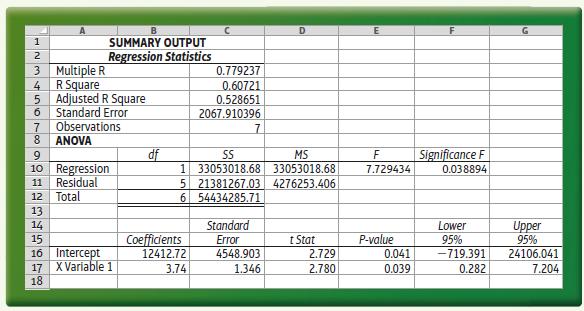
Using the data provided in E6-55B, the laboratory manager performed a regression analysis to predict total laboratory overhead costs. The output generated by Excel is as follows:
Requirements:
1. Determine the lab’s cost equation (use the output from the Excel regression).
2. Determine the R-squared (use the output from the Excel regression).
3. Predict the total laboratory overhead for the month if 2,700 tests are performed.
Data From E6-55B:-
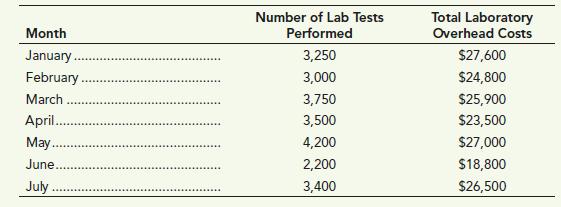
The manager of the main laboratory facility at Rosedale Health Center is interested in being able to predict the overhead costs each month for the lab. The manager believes that total overhead varies with the number of lab tests performed but that some costs remain the same each month regardless of the number of lab tests performed.
The lab manager collected the following data for the first seven months of the year.
D G 3 Multiple R R Square SUMMARY OUTPUT Regression Statistics 5 Adjusted R Square 1234567890128 Standard Error Observations ANOVA 10 Regression Residual 12 Total 16 Intercept 17 X Variable 1 0.779237 0.60721 0.528651 2067.910396 df 55 MS F 1 33053018.68 33053018.68 7.729434 5 21381267.03 4276253.406 Coefficients 12412.72 6 54434285.71 3.74 Standard Error Significance F 0.038894 Lower t Stat P-value 95% 4548.903 2.729 0.041 -719.391 1.346 2.780 0.039 0.282 Upper 95% 24106.041 7.204
Step by Step Solution
3.31 Rating (151 Votes )
There are 3 Steps involved in it

Get step-by-step solutions from verified subject matter experts