

Question: Using the data from problem 1, you have been asked to develop an overall cause-and effect chart explaining why students arrived so early. Data from
Using the data from problem 1, you have been asked to develop an overall cause-and effect chart explaining why students arrived so early.
Data from in problem 1
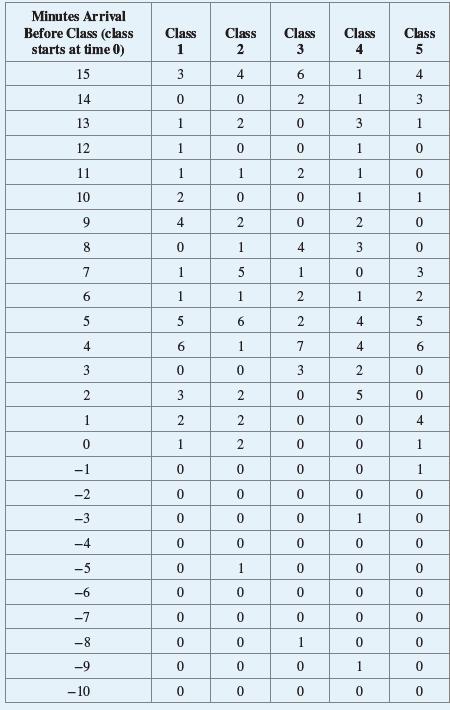
Minutes Arrival Before Class (class starts at time 0) 15 14 13. 12 11 10 9 8 7 6 5 4 3 2 1 0 -1 -2 -3 -4 -5 -6 -7 -8 -9 -10 = Class 1 3 0 1 1 1 2 4 0 1 1 5 6 0 3 2 1 0 0 0 0 0 0 0 0 0 0 Class 2 4 0 2 0 1 0 2 1 5 1 6 1 0 2 2 2 0 0 0 0 1 0 0 0 0 0 Class 3 6 2 0 0 2 0 0 4 1 2 2 7 3 0 0 0 0 0 0 0 0 0 0 1 0 0 Class 4 1 1 3 1 1 1 2 3 0 1 4 4 2 5 0 0 0 0 1 0 0 0 0 0 1 0 Class 5 4 3 1 0 0 1 0 0 3 2 5 6 0 0 4 1 1 0 0 0 0 0 0 0 0 0
Step by Step Solution
3.58 Rating (155 Votes )
There are 3 Steps involved in it
Solution My explanation is that the reason students arri... View full answer

Get step-by-step solutions from verified subject matter experts