

Answer the questions below using the cost curves for the price-taking firm shown in the following graph:
Question:
Answer the questions below using the cost curves for the price-taking firm shown in the following graph: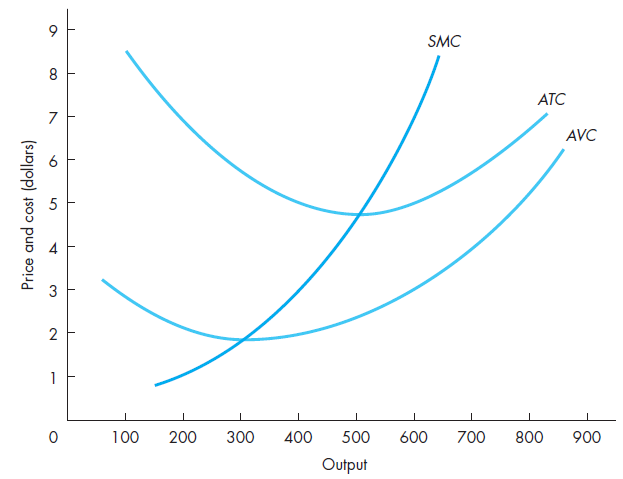
a. If price is $7 per unit of output, draw the marginal revenue curve. The manager should produce__________ units to maximize profit.b. Because average total cost is $__________ for this output, total cost is $ __________.c. The firm makes a profit of $ __________.d. At __________units, profit margin (or average profit) is maximized. Why is this output level different from the answer to part a?e. Let price fall to $3, and draw the new marginal revenue curve. The manager should now produce__________ units to maximize profit.f. Total revenue is now $__________ and total cost is $ __________. The firm makes a loss of $ __________.g. Total variable cost is $ __________, leaving $__________ to apply to fixed cost.h. If price falls below $ __________, the firm will produce zero output. Explain why.
Step by Step Answer:
a a If price is 7 per unit of output draw the marginal revenue curve The manager should produce 600 units to maximize profit When P7 the marginal reve...View the full answer


Managerial Economics Foundations of Business Analysis and Strategy
ISBN: 978-0078021909
12th edition
Authors: Christopher Thomas, S. Charles Maurice
