

Ten data points on Y and X are employed to estimate the parameters in the linear relation
Question:
Ten data points on Y and X are employed to estimate the parameters in the linear relation Y = a + bX. The computer output from the regression analysis is the following:
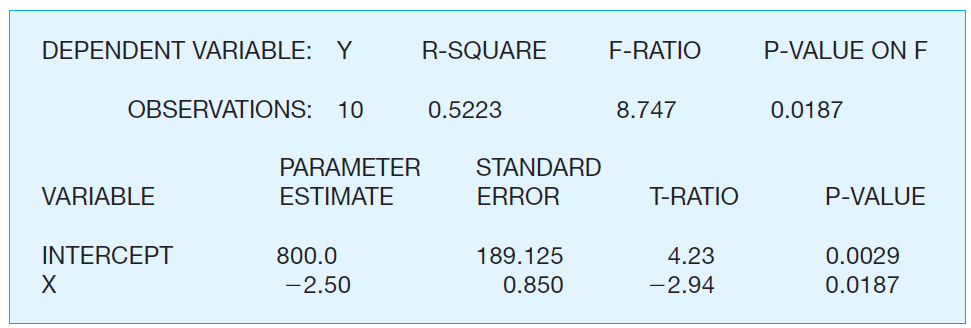
a. What is the equation of the sample regression line?b. Test the intercept and slope estimates for statistical significance at the 1 percent significance level. Explain how you performed this test, and present your results.c. Interpret the p-values for the parameter estimates.d. Test the overall equation for statistical significance at the 1 percent significance level. Explain how you performed this test, and present your results. Interpret the p-value for the F-statistic.e. If X equals 140, what is the fitted (or predicted) value of Y?f. What fraction of the total variation in Y is explained by the regression?
Step by Step Answer:
a Sample regression line Y 800 250x b At 1 level of significance Alpha a 001 The intercept Pvalue is ...View the full answer


Managerial Economics Foundations of Business Analysis and Strategy
ISBN: 978-0078021909
12th edition
Authors: Christopher Thomas, S. Charles Maurice
