

The following figure shows long-run average and marginal cost curves for a competitive firm. The price of
Question:
The following figure shows long-run average and marginal cost curves for a competitive firm. The price of the product is $40.
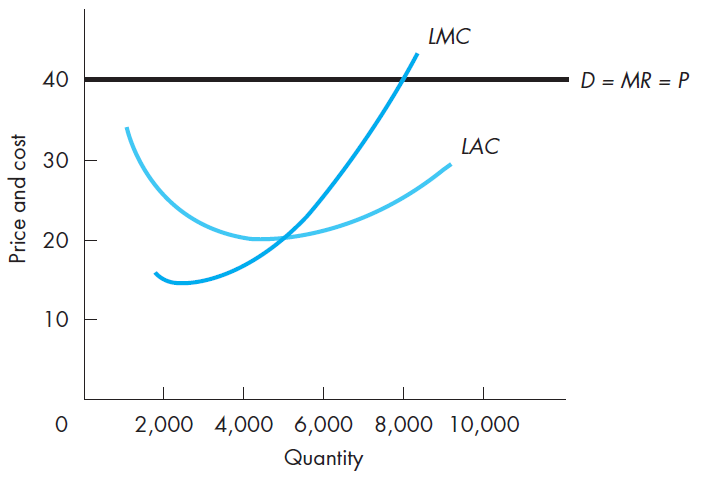
a. How much will the firm produce? What will be its economic profit?b. When the industry attains long-run competitive equilibrium, what will be the price and the firm?s output? What will be the firm?s economic profit?
Fantastic news! We've Found the answer you've been seeking!
Step by Step Answer:
a The firm will produce 8000 units of goods ProfitPATCQuantity 40258000 1...View the full answer

Answered By
Priyansha Nemwal
I am a graduate in economics with maths and statistics as a compulsory subject. I have been tutoring online for the past 3 years for high school and college-level economics. I have also tutored for other subjects as well like maths, social science, and science for junior classes.
0 Reviews
10+ Question Solved
Related Book For 
Managerial Economics Foundations of Business Analysis and Strategy
ISBN: 978-0078021909
12th edition
Authors: Christopher Thomas, S. Charles Maurice
Question Posted:
