

Use the graph below to answer the following questions: a. At 60 units of the activity, marginal
Question:
Use the graph below to answer the following questions: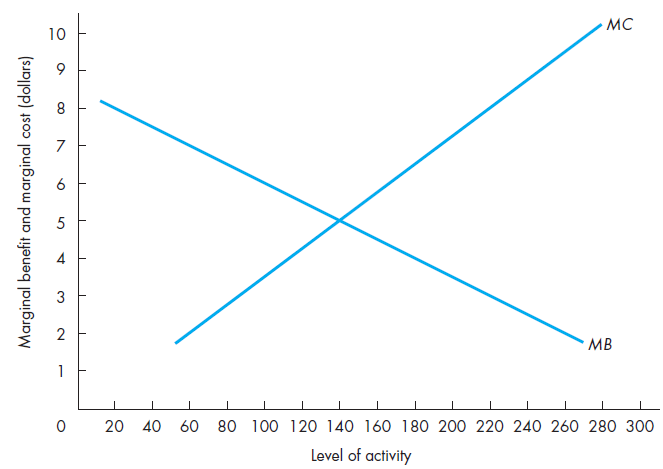
a. At 60 units of the activity, marginal benefit is $___________ and marginal cost is $___________.b. Adding the 60th unit of the activity causes net benefit to ___________(increase, decrease) by $___________.c. At 220 units of the activity, marginal benefit is $___________ and marginal cost is $___________.d. Subtracting the 220th unit of the activity causes net benefit to___________ (increase, decrease) by $___________.e. The optimal level of the activity is___________ units. At the optimal level of the activity, marginal benefit is $___________ and marginal cost is $___________.
Fantastic news! We've Found the answer you've been seeking!
Step by Step Answer:
a At 60 units of the activity marginal benefit is 7 and marginal cost is 2 bAdding the 60th ...View the full answer

Answered By
Agust Dhalia
I completed my bachelor's degree in B.com from university of mumbai as a regular student. Now i am doing two Master's degree , first is M.com and second is MA in Economics. I decided my career track as professor or 1st grade teacher. I love teaching lessons to student. I also preparing for competition exam that is UGC NET / JRF in economics and i also teach 11th , 12th student's at my home when i was in degree college. I have ability to teach as 6 to 8 hours without consuming a glass of water.
0 Reviews
10+ Question Solved
Related Book For 

Managerial Economics Foundations of Business Analysis and Strategy
ISBN: 978-0078021909
12th edition
Authors: Christopher Thomas, S. Charles Maurice
Question Posted:
