

Question: The following table is a discriminant analysis that examines responses to various attitudinal questions from cable TV users, former cable TV users, and people who
The following table is a discriminant analysis that examines responses to various attitudinal questions from cable TV users, former cable TV users, and people who have never used cable TV. Looking at the various discriminant weights, what can you say about each of the three groups?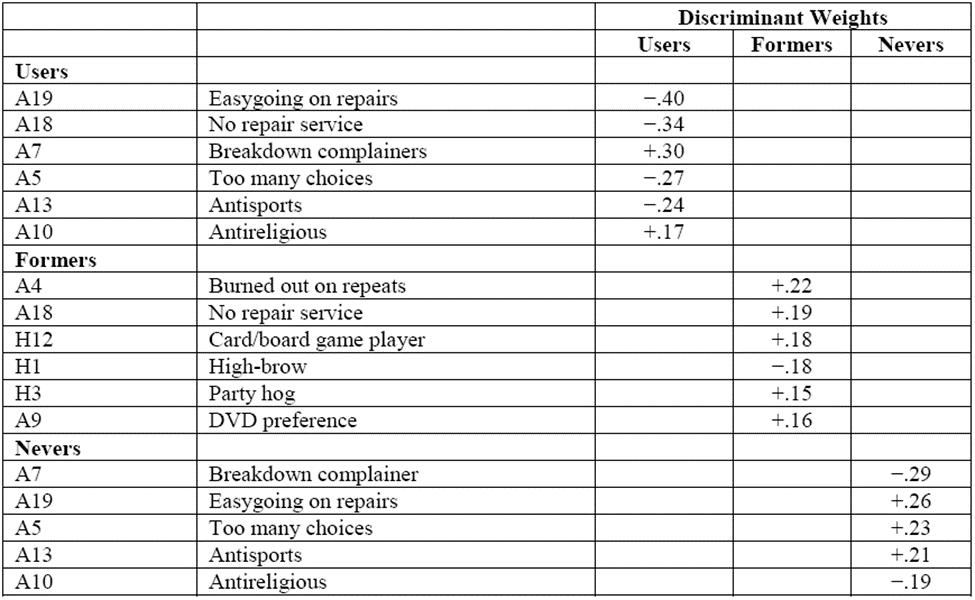
Users A19 A18 A7 A5 A13 A10 Formers A4 A18 H12 H1 H3 A9 Nevers A7 A19 A5 A13 A10 Easygoing on repairs No repair service Breakdown complainers Too many choices Antisports Antireligious Burned out on repeats No repair service Card/board game player High-brow Party hog DVD preference Breakdown complainer Easygoing on repairs Too many choices Antisports Antireligious Discriminant Weights Users -.40 -.34 +.30 -.27 -.24 +.17 Formers Nevers +.22 +.19 +.18 -.18 +.15 +.16 -.29 +.26 +.23 +.21 -.19
Step by Step Solution
3.40 Rating (172 Votes )
There are 3 Steps involved in it
For users the most discriminating variables are A19 ... View full answer

Get step-by-step solutions from verified subject matter experts