

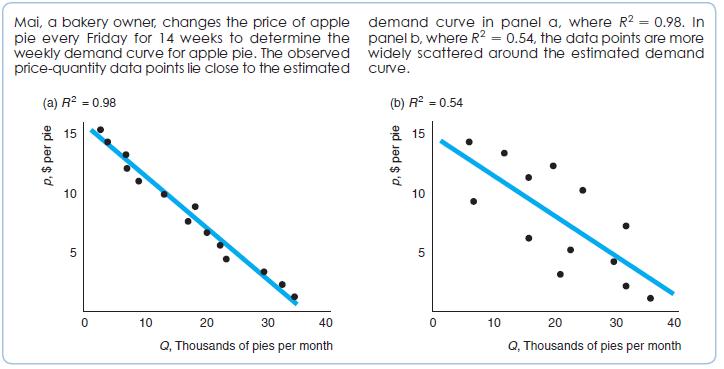
In Figure 3.5 two estimated demand curves are shown. These demand curves result from regression equations in
Question:
In Figure 3.5 two estimated demand curves are shown. These demand curves result from regression equations in which Mai estimates quantity demanded as a function of price and no other variables. However, Mai recognized that other variables, such as sunshine or temperature, may affect the demand for pie. Collecting this data requires effort. In which town should collecting such data be a higher priority for Mai if she is trying to improve her ability to predict pie demand? Explain.
Figure 3.5
Fantastic news! We've Found the answer you've been seeking!
Step by Step Answer:
M ai should prioritize collecting data on other variables like sunshine or temperature in the town with the demand curve in Panel B R 2 0 54 This is b...View the full answer

Answered By
Faith mumo
I am a highly experienced, enthusiastic, and determined professional writer and tutor with four years of experience both in person, and online. I have an in-depth knowledge of mathematics, the social sciences, and the humanities, among other business-related disciplines. I have a proven ability to help students of all levels to understand difficult concepts and to take ownership of their learning process. I have encountered many projects, and my clients have always been happy about my work. I need to say that writing is more of a passion than a profession to me. I like writing and aspire to improve my writing abilities in every step I make. I have excellent communication skills, and also have a perfect technique for convincing the readers of my works. I like researching to enrich my work as per the customer's demands; however, I ensure my paper is plagiarism-free as I explore. I also have a strong record of helping students develop their problem-solving skills, providing them with real-world experience, and achieve their academic goals. My teaching style is interactive, with plenty of time for questions and discussions, and I often provide one-on-one guidance to ensure that my students understand the material.
0 Reviews
10+ Question Solved
Related Book For 
Managerial Economics And Strategy
ISBN: 9780134899701
3rd Edition
Authors: Jeffrey M. Perloff, James A. Brander
Question Posted:
