

The company that makes Fitbit, the wristband that tracks exercise and sleep, commissioned a report that included
Question:
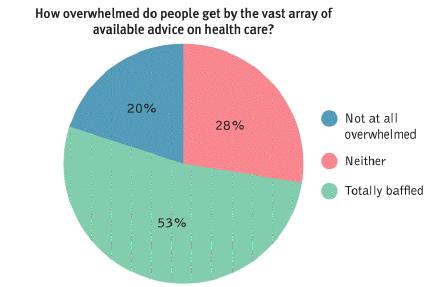
The company that makes Fitbit, the wristband that tracks exercise and sleep, commissioned a report that included the pie chart shown here (2013).
a. Explain why a bar graph would be more suitable for these data than a pie chart.
b. What statistical lie appears to be present in these data?
Description
Data from the chart are summarized as follows.
Not at all overwhelmed-20 percent
Neither-28 percent
Totally baffled-53 percent
Fantastic news! We've Found the answer you've been seeking!
Step by Step Answer:
A Pie charts are best to use when you are trying to compa...View the full answer

Answered By
Antony Mutonga
I am a professional educator and writer with exceptional skills in assisting bloggers and other specializations that necessitate a fantastic writer. One of the most significant parts of being the best is that I have provided excellent service to a large number of clients. With my exceptional abilities, I have amassed a large number of references, allowing me to continue working as a respected and admired writer. As a skilled content writer, I am also a reputable IT writer with the necessary talents to turn papers into exceptional results.
2+ Reviews
10+ Question Solved
Related Book For 

Statistics For The Behavioral Sciences
ISBN: 9781319190743
5th Edition
Authors: Susan A. Nolan, Thomas Heinzen
Question Posted:
