

Construct the histogram that corresponds to the frequency distribution from Exercise 1. Use class midpoint values for
Question:
Construct the histogram that corresponds to the frequency distribution from Exercise 1. Use class midpoint values for the horizontal scale. Does the histogram suggest that the data are from a population having a normal distribution? Why or why not?
Data From Exercise 1:
Construct a frequency distribution of the 20 body temperatures (oF) listed below. (These data are from Data Set 3 “Body Temperatures” in Appendix B.) Use a class width of 0.5oF and a starting value of 97.0oF.
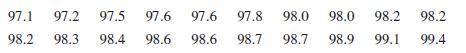
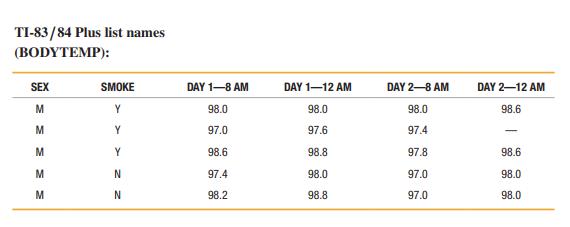
Data Set 3: Body Temperatures
Body temperatures (oF) are from 107 subjects taken on two consecutive days at 8 AM and 12 AM (first five rows shown here). SEX is gender of subject, and SMOKE indicates if subject smokes (Y) or does not smoke (N). Data provided by Dr. Steven Wasserman, Dr. Philip Mackowiak, and Dr. Myron Levine of the University of Maryland.
D1T8, D1T12, D2T8, D2T12 (no list for SEX and SMOKE). Missing data values are represented by 9999.
Step by Step Answer:


Mathematical Interest Theory
ISBN: 9781470465681
3rd Edition
Authors: Leslie Jane, James Daniel, Federer Vaaler
