

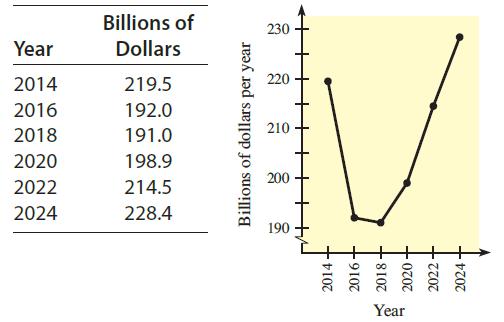
Crude oil and petroleum products are imported continuously by the United States. The following table and figure
Question:
Crude oil and petroleum products are imported continuously by the United States. The following table and figure show the net expenditures for
U.S. oil imports for selected years (in billions of dollars per year).
(a) Use n = 5 equal subdivisions and left-hand endpoints to estimate the area under the graph from 2014 to 2024.
(b) What does this area represent in terms of U.S. oil imports?
Fantastic news! We've Found the answer you've been seeking!
Step by Step Answer:
a A 22195 1920 1910 1989 2145 20...View the full answer

Answered By
Anjali Arora
Having the experience of 16 years in providing the best solutions with a proven track record of technical contribution and appreciated for leadership in enhancing team productivity, deliverable quality, and customer satisfaction. Expertise in providing the solution in Computer Science, Management, Accounting, English, Statistics, and Maths.
Also, do website designing and Programming.
Having 7 yrs of Project Management experience.
100% satisfactory answers.
3+ Reviews
10+ Question Solved
Related Book For 

Mathematical Applications For The Management, Life And Social Sciences
ISBN: 9781337625340
12th Edition
Authors: Ronald J. Harshbarger, James J. Reynolds
Question Posted:
