

Question: Data Set 1 Body Data in Appendix B includes ages of 147 randomly selected adult females, and those ages have a standard deviation of 17.7
Data Set 1 “Body Data” in Appendix B includes ages of 147 randomly selected adult females, and those ages have a standard deviation of 17.7 years. Assume that ages of female statistics students have less variation than ages of females in the general population, so let σ = 17.7 years for the sample size calculation. How many female statistics student ages must be obtained in order to estimate the mean age of all female statistics students? Assume that we want 95% confidence that the sample mean is within one-half year of the population mean. Does it seem reasonable to assume that ages of female statistics students have less variation than ages of females in the general population?
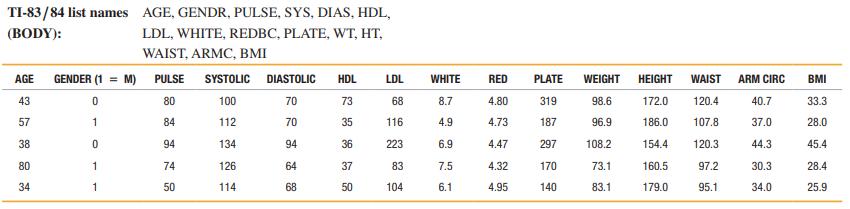
Data Set 1: Body Data
Body and exam measurements are from 300 subjects (first five rows shown here). AGE is in years, for GENDER 1 = male and 0 = female, PULSE is pulse rate (beats per minute), SYSTOLIC is systolic blood pressure (mm Hg), DIASTOLIC is diastolic blood pressure (mm Hg), HDL is HDL cholesterol (mg/dL), LDL is LDL cholesterol (mg/dL), WHITE is white blood cell count (1000 cells/mL), RED is red blood cell count (million cells/mL), PLATE is platelet count (1000 cells/mL), WEIGHT is weight (kg), HEIGHT is height (cm), WAIST is waist circumference (cm), ARM CIRC is arm circumference (cm), and BMI is body mass index (kg/m2). Data are from the National Center for Health Statistics.
Step by Step Solution
3.51 Rating (161 Votes )
There are 3 Steps involved in it
To estimate the sample size needed to achieve a given level of confidence in a sample mean we can us... View full answer

Get step-by-step solutions from verified subject matter experts