

Data Set 21 Earthquakes in Appendix B lists earthquake depths, and the summary statistics are n =
Question:
Data Set 21 “Earthquakes” in Appendix B lists earthquake depths, and the summary statistics are n = 600, x = 5.82 km, s = 4.93 km. Use a 0.01 significance level to test the claim of a seismologist that these earthquakes are from a population with a mean equal to 5.00 km.
Assume that a simple random sample has been selected and test the given claim. Unless specified by your instructor, use either the P-value method or the critical value method for testing hypotheses. Identify the null and alternative hypotheses, test statistic, P-value (or range of P-values), or critical value(s), and state the final conclusion that addresses the original claim.
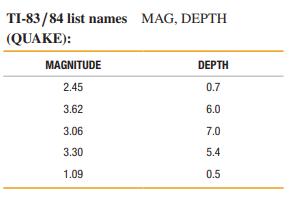
Data Set 21: Earthquakes
Data are from 600 matched pairs (first five rows shown here) of magnitude/depth measurements randomly selected from 10,594 earthquakes recorded in one year from a location in southern California. Only earthquakes with a magnitude of at least 1.00 are used. MAGNITUDE is magnitude measured on the Richter scale and DEPTH is depth in km. The magnitude and depth both describe the source of the earthquake. The data are from the Southern California Earthquake Data Center.
Step by Step Answer:
To test the seismologists claim we will use the following steps Identify the null and alternative hypotheses The null hypothesis is that the mean eart...View the full answer


Mathematical Interest Theory
ISBN: 9781470465681
3rd Edition
Authors: Leslie Jane, James Daniel, Federer Vaaler
