

Listed below are student evaluation ratings of courses, where a rating of 5 is for excellent. The
Question:
Listed below are student evaluation ratings of courses, where a rating of 5 is for “excellent.” The ratings were obtained at the University of Texas at Austin. (See Data Set 17 “Course Evaluations” in Appendix B.) Using the bootstrap method with 1000 bootstrap samples, construct a 90% confidence interval estimate of m. How does the result compare to the confidence interval found in Exercise 23 “Student Evaluations” in Section 7-2 on page 330?
![]()
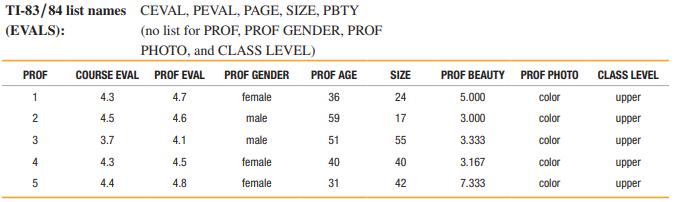
Data Set 17: Course Evaluations
Data are from 93 college student course evaluations (first five rows shown here). COURSE EVAL includes the mean course rating, PROF EVAL includes the mean professor rating, PROF AGE includes the professor age in years, SIZE includes the number of course evaluations per course, PROF BEAUTY includes the mean beauty rating based on the professor’s photo.
Based on data from Andrew Gelman and Jennifer Hill, 2007, “Replication Data for Data Analysis Using Regression Multilevel/Hierarchical Models,” http://hdl.handle.net/1902.1/10285.
Data From Exercise 23 Section 7-2:
A study of 420,095 Danish cell phone users found that 0.0321% of them developed cancer of the brain or nervous system. Prior to this study of cell phone use, the rate of such cancer was found to be 0.0340% for those not using cell phones. The data are from the Journal of the National Cancer Institute.
Step by Step Answer:


Mathematical Interest Theory
ISBN: 9781470465681
3rd Edition
Authors: Leslie Jane, James Daniel, Federer Vaaler
