

Listed on the top of the next page in order by row are the annual high values
Question:
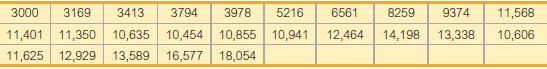
Listed on the top of the next page in order by row are the annual high values of the Dow Jones Industrial Average for each year beginning with 1990. Find the best model and then predict the value for the year 2014 (the last year listed). Is the predicted value close to the actual value of 18,054?
Construct a scatterplot and identify the mathematical model that best fits the given data. Assume that the model is to be used only for the scope of the given data, and consider only linear, quadratic, logarithmic, exponential, and power models.
Fantastic news! We've Found the answer you've been seeking!
Step by Step Answer:

Answered By
RADHIKA MEENAKAR
I am a qualified indian Company Secretary along with Masters in finance with over 6 plus years of professional experience. Apart from this i am a certified accounts and finance tutor on many online platforms.
My Linkedin profile link is here https://www.linkedin.com/in/radhika-meenakar-88b9808a/
12+ Reviews
22+ Question Solved
Related Book For 

Mathematical Interest Theory
ISBN: 9781470465681
3rd Edition
Authors: Leslie Jane, James Daniel, Federer Vaaler
Question Posted:
