

The figure is a typical graph of worker productivity as a function of time on the job.
Question:
The figure is a typical graph of worker productivity as a function of time on the job.
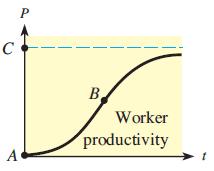
(a) If P represents the productivity and t represents the time, write a mathematical symbol that represents the rate of change of productivity with respect to time.
(b) Which of A, B, and C is the critical point for the rate of change found in part (a)? This point actually corresponds to the point at which the rate of production is maximized or the point for maximum worker efficiency. In economics, this is called the point of diminishing returns.
(c) Which of A, B, and C corresponds to the upper limit of worker productivity?
Fantastic news! We've Found the answer you've been seeking!
Step by Step Answer:
a Pt ...View the full answer

Answered By
Ajeet Singh
Professional, Experienced, and Expert tutor who will provide speedy and to-the-point solutions.
I have been teaching students for 5 years now in different subjects and it's truly been one of the most rewarding experiences of my life.
I have also done one-to-one tutoring with 100+ students and help them achieve great subject knowledge.
I have expertise in computer subjects like C++, C, Java, and Python programming and other computer Science related fields.
Many of my student's parents message me that your lessons improved their children's grades and this is the best only thing you want as a teacher. I have done plenty of studying and lots of learning on many exciting and challenging topics. All these experiences have influenced my decision to take on the teaching role in various capacities. As a tutor, I am looking forward to getting to understand your needs and helping you achieve your academic goals. I'm highly flexible and contactable. I am available to work on short notice since I only prefer to work with very small and select groups of students.
7+ Reviews
15+ Question Solved
Related Book For 

Mathematical Applications For The Management, Life And Social Sciences
ISBN: 9781337625340
12th Edition
Authors: Ronald J. Harshbarger, James J. Reynolds
Question Posted:
