

The figure shows the sales growth rates under different levels of distribution and advertising from a to
Question:
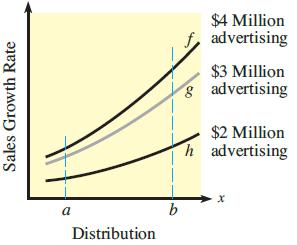
The figure shows the sales growth rates under different levels of distribution and advertising from a to b. Set up an integral to determine the extra sales growth if $4 million is used in advertising rather than $2 million.
Fantastic news! We've Found the answer you've been seeking!
Step by Step Answer:
The e...View the full answer

Answered By
Felix Onchweri
I have enough knowledge to handle different assignments and projects in the computing world. Besides, I can handle essays in different fields such as business and history. I can also handle both short and long research issues as per the requirements of the client. I believe in early delivery of orders so that the client has enough time to go through the work before submitting it. Am indeed the best option that any client that can think about.
5+ Reviews
19+ Question Solved
Related Book For 

Mathematical Applications For The Management, Life And Social Sciences
ISBN: 9781337625340
12th Edition
Authors: Ronald J. Harshbarger, James J. Reynolds
Question Posted:
