

The following table gives the U.S. national consumption and disposable income (both in billions of dollars) for
Question:
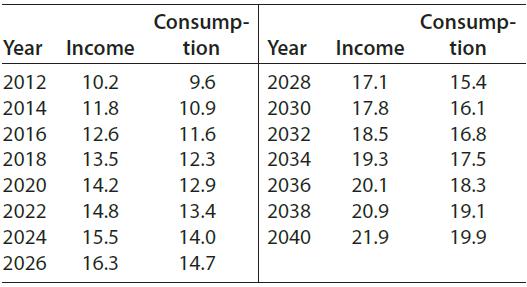
The following table gives the U.S. national consumption and disposable income (both in billions of dollars) for selected years from 2012 and projected to 2040. Suppose the marginal propensity to consume can be modeled by
dC/dy = 0.0169y + 0.617
where y equals the disposable income.
(a) Use the data point for 2012 to find the U.S. national consumption function.
(b) Use the data to develop a model of the same function type as found in part (a). Report your model with 3 significant digit coefficients.
(c) Compare your answers to parts (a) and (b). Name one other function type that would be a good model for these data.
Fantastic news! We've Found the answer you've been seeking!
Step by Step Answer:
dCdy 00169y 0617 C y 00169y 0617dy 000845y 2 0617y K a Using C102 96 96 ...View the full answer

Answered By
Susan Juma
I'm available and reachable 24/7. I have high experience in helping students with their assignments, proposals, and dissertations. Most importantly, I'm a professional accountant and I can handle all kinds of accounting and finance problems.
15+ Reviews
45+ Question Solved
Related Book For 

Mathematical Applications For The Management, Life And Social Sciences
ISBN: 9781337625340
12th Edition
Authors: Ronald J. Harshbarger, James J. Reynolds
Question Posted:
