

The following table gives the U.S. national consumption and disposable income (both in billions of dollars) for
Question:
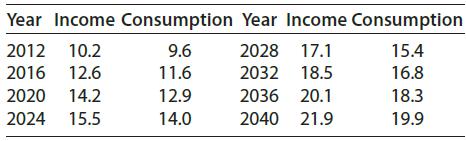
The following table gives the U.S. national consumption and disposable income (both in billions of dollars) for presidential election years from 2012 and projected to 2040.
(a) Use linear regression to find the linear equation that is the best fit for these data, with y representing the disposable income and C representing the consumption. Report the model with 3 significant digits.
(b) Graph the data and the linear regression line and discuss the fit.
(c) Use the linear model to predict the U.S. disposable income when the U.S. national consumption is $19 billion.
(d) Find and interpret the slope of the reported model.
Fantastic news! We've Found the answer you've been seeking!
Step by Step Answer:
a C 0885x 0413 b c 19 0885x 0413 19 04...View the full answer

Answered By
Muhammad Umair
I have done job as Embedded System Engineer for just four months but after it i have decided to open my own lab and to work on projects that i can launch my own product in market. I work on different softwares like Proteus, Mikroc to program Embedded Systems. My basic work is on Embedded Systems. I have skills in Autocad, Proteus, C++, C programming and i love to share these skills to other to enhance my knowledge too.
1+ Reviews
10+ Question Solved
Related Book For 

Mathematical Applications For The Management, Life And Social Sciences
ISBN: 9781337625340
12th Edition
Authors: Ronald J. Harshbarger, James J. Reynolds
Question Posted:
