

Using the heights and weights described in Exercise 1, a height of 180 cm is used to
Question:
Using the heights and weights described in Exercise 1, a height of 180 cm is used to find that the predicted weight is 91.3 kg, and the 95% prediction interval is (59.0 kg, 123.6 kg). Write a statement that interprets that prediction interval. What is the major advantage of using a prediction interval instead of simply using the predicted weight of 91.3 kg? Why is the terminology of prediction interval used instead of confidence interval?
Data From Exercise 1:
Using Data Set 1 “Body Data” in Appendix B, if we let the predictor variable x represent heights of males and let the response variable y represent weights of males, the sample of 153 heights and weights results in se = 16.27555 cm. In your own words, describe what that value of se represents.
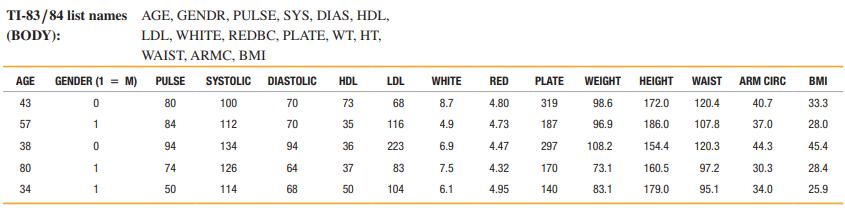
Data Set 1: Body Data
Body and exam measurements are from 300 subjects (first five rows shown here). AGE is in years, for GENDER 1 = male and 0 = female, PULSE is pulse rate (beats per minute), SYSTOLIC is systolic blood pressure (mm Hg), DIASTOLIC is diastolic blood pressure (mm Hg), HDL is HDL cholesterol (mg/dL), LDL is LDL cholesterol (mg/dL), WHITE is white blood cell count (1000 cells/mL), RED is red blood cell count (million cells/mL), PLATE is platelet count (1000 cells/mL), WEIGHT is weight (kg), HEIGHT is height (cm), WAIST is waist circumference (cm), ARM CIRC is arm circumference (cm), and BMI is body mass index (kg/m2). Data are from the National Center for Health Statistics.
Step by Step Answer:


Mathematical Interest Theory
ISBN: 9781470465681
3rd Edition
Authors: Leslie Jane, James Daniel, Federer Vaaler
