

Figure 5 shows the scatter plot for white spruce trees in the Jack Haggerty Forest at Lakehead
Question:
Figure 5 shows the scatter plot for white spruce trees in the Jack Haggerty Forest at Lakehead University in Canada. A regression model produced by a spreadsheet (Fig. 5), after rounding, is h = 1.8d + 34 where d is Dbh in inches and h is the height in feet.
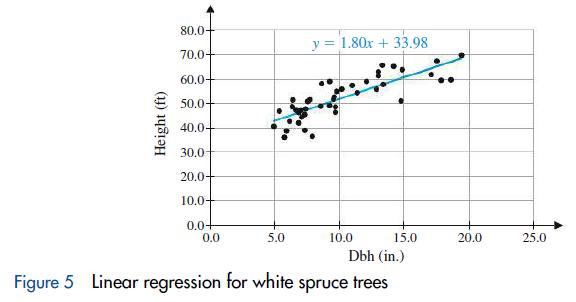
(A) Interpret the slope of this model.
(B) What is the effect of a 1-inch increase in Dbh?
(C) Estimate the height of a white spruce with a Dbh of 10 inches. Round your answer to the nearest foot.
(D) Estimate the Dbh of a white spruce that is 65 feet tall. Round your answer to the nearest inch.
Fantastic news! We've Found the answer you've been seeking!
Step by Step Answer:
A The slope is 18 so the rate ...View the full answer

Answered By
Carly Cimino
As a tutor, my focus is to help communicate and break down difficult concepts in a way that allows students greater accessibility and comprehension to their course material. I love helping others develop a sense of personal confidence and curiosity, and I'm looking forward to the chance to interact and work with you professionally and better your academic grades.
12+ Reviews
21+ Question Solved
Related Book For 

Finite Mathematics For Business Economics Life Sciences And Social Sciences
ISBN: 9780134862620
14th Edition
Authors: Raymond Barnett, Michael Ziegler, Karl Byleen, Christopher Stocker
Question Posted:
