

One hundred healthy mice were weighed at the beginning of an experiment with the following results: (A)
Question:
One hundred healthy mice were weighed at the beginning of an experiment with the following results:
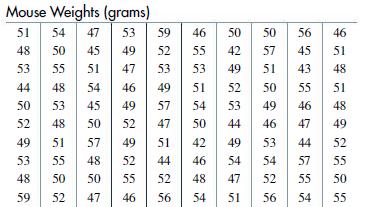
(A) Construct a frequency and relative frequency table using a class interval of 2, starting at 41.5.
(B) Construct a histogram.
(C) Construct a frequency polygon.
(D) Construct a cumulative frequency and relative cumulative frequency table. What is the probability of a mouse weight drawn at random from the sample lying between 45.5 and 53.5?
(E) Construct a cumulative frequency polygon.
Fantastic news! We've Found the answer you've been seeking!
Step by Step Answer:

Answered By
Caroline Kinuthia
Taking care of the smaller details in life has a larger impact in our general well being, and that is what i believe in. My name is Carol. Writing is my passion. To me, doing a task is one thing, and delivering results from the task is another thing. I am a perfectionist who always take things seriously and deliver to the best of my knowledge.
1933+ Reviews
4269+ Question Solved
Related Book For 

Finite Mathematics For Business Economics Life Sciences And Social Sciences
ISBN: 9780134862620
14th Edition
Authors: Raymond Barnett, Michael Ziegler, Karl Byleen, Christopher Stocker
Question Posted:
