

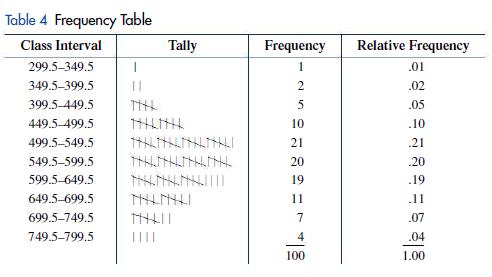
Referring to Table 4 and the probability distribution just described, determine the probability that (A) A randomly
Question:
Referring to Table 4 and the probability distribution just described, determine the probability that
(A) A randomly drawn score is between 499.5 and 549.5.
(B) A randomly drawn score is between 449.5 and 649.5.
Fantastic news! We've Found the answer you've been seeking!
Step by Step Answer:
A Since the relative frequency associated with the class interval 49955495 is 21 the pro...View the full answer

Answered By
Cristine kanyaa
I possess exceptional research and essay writing skills. I have successfully completed over 5000 projects and the responses are positively overwhelming . I have experience in handling Coursework, Session Long Papers, Manuscripts, Term papers, & Presentations among others. I have access to both physical and online library. this makes me a suitable candidate to tutor clients as I have adequate materials to carry out intensive research.
1538+ Reviews
3254+ Question Solved
Related Book For 

Finite Mathematics For Business Economics Life Sciences And Social Sciences
ISBN: 9780134862620
14th Edition
Authors: Raymond Barnett, Michael Ziegler, Karl Byleen, Christopher Stocker
Question Posted:
