

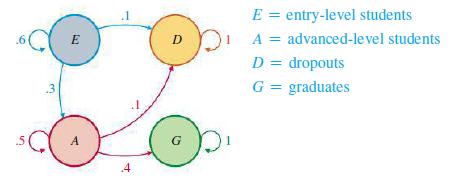
Repeat Example 5 for the following transition diagram: Data from Example 5 The following transition diagram is
Question:
Repeat Example 5 for the following transition diagram:
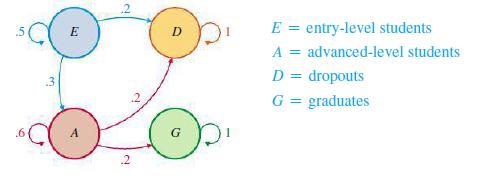
Data from Example 5
The following transition diagram is for part-time students enrolled in a university MBA program:
(A) In the long run, what percentage of entry-level students will graduate? What percentage of advanced-level students will not graduate?
(B) What is the average number of years that an entry-level student will remain in this program? An advanced-level student?
Fantastic news! We've Found the answer you've been seeking!
Step by Step Answer:
A Thirty percent of entrylevel students will grad...View the full answer

Answered By
Md khalid shaifuallah
My self Md khalid I have complete academic qualifications in 2004 from Jac ranchi. And after that I have diploma in mechanical engineering completed in 2011 from AL kabir polytechnic jamshedpur and also b tech in mechanical engineering have completed from kolhan University jharkhand and now I'm in tata steel Ltd as a post of mechanical maintenance engineer.
I maintenance the conveyor system in this system there are different types of rotating equipments used all this type of parts maintenance time to time. We are attend the brack dwon maintenance with the safety. I motivate to the worker through the classes. And as far as i want to tell I have been in work in Transtutor,Chegg, tutor bin, Quesba and also now I am tutoring up to in this tutoring site.
0 Reviews
10+ Question Solved
Related Book For 

Finite Mathematics For Business Economics Life Sciences And Social Sciences
ISBN: 9780134862620
14th Edition
Authors: Raymond Barnett, Michael Ziegler, Karl Byleen, Christopher Stocker
Question Posted:
