

The U.S. Census Bureau published the data in Table 1 on home ownership rates. Let x represent
Question:
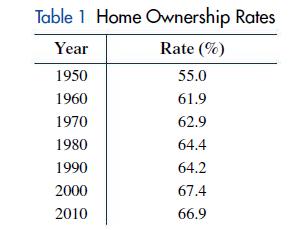
The U.S. Census Bureau published the data in Table 1 on home ownership rates. Let x represent time in years with x = 0 representing 1900. Use logarithmic regression to find the best model of the form y = a + b ln x for the home ownership rate y as a function of time x. Use the model to predict the home ownership rate in the United States in 2025 (to the nearest tenth of a percent).
Fantastic news! We've Found the answer you've been seeking!
Step by Step Answer:
Enter the data in a graphing calculator Fig 7A and f...View the full answer

Answered By
Fahmin Arakkal
Tutoring and Contributing expert question and answers to teachers and students.
Primarily oversees the Heat and Mass Transfer contents presented on websites and blogs.
Responsible for Creating, Editing, Updating all contents related Chemical Engineering in
latex language
8+ Reviews
22+ Question Solved
Related Book For 

Finite Mathematics For Business Economics Life Sciences And Social Sciences
ISBN: 9780134862620
14th Edition
Authors: Raymond Barnett, Michael Ziegler, Karl Byleen, Christopher Stocker
Question Posted:
