

Question: To simulate roulette on a graphing calculator, a random integer between -1 and 36 is selected (-1 represents 00; see Problem 35). The command in
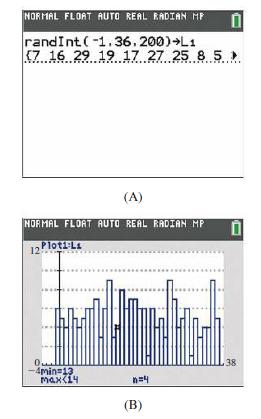
To simulate roulette on a graphing calculator, a random integer between -1 and 36 is selected (-1 represents 00; see Problem 35). The command in Figure A simulates 200 games.
(A) Use the statistical plot in Figure B to determine the net gain or loss of placing a $1 bet on the number 13 in each of the 200 games.
(B) Compare the results of part (A) with the expected value of the game.
(C) Use a graphing calculator to simulate betting $1 on the number 7 in each of 500 games of roulette and compare the simulated and expected gains or losses.
Data from Problem 35
Roulette wheels in Nevada generally have 38 equally spaced slots numbered 00, 0, 1, 2,c, 36. A player who bets $1 on any given number wins $35 (and gets the bet back) if the ball comes to rest on the chosen number; otherwise, the $1 bet is lost. What is the expected value of this game?
NORMAL FLOAT AUTO REAL RADIAN MP 0 randInt (-1.36.200)L1 (7.16 29.19.17 27.25 8.5 NORMAL FLOAT AUTO REAL RADIAN MP Ploti Li 12 (A) 0 -4min=13 Max 14 n=4 (B) 0 38
Step by Step Solution
3.38 Rating (160 Votes )
There are 3 Steps involved in it

Get step-by-step solutions from verified subject matter experts