

Use the broken-line graph shown to estimate the median age in 1900 and 2000. In which decades
Question:
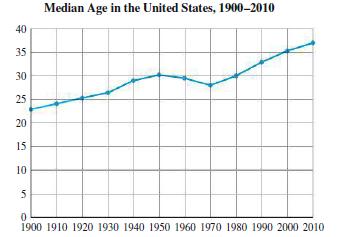
Use the broken-line graph shown to estimate the median age in 1900 and 2000. In which decades did the median age increase? In which did it decrease? Discuss the factors that may have contributed to the increases and decreases.
Step by Step Answer:

This question has not been answered yet.
You can Ask your question!
Related Book For 

Finite Mathematics For Business Economics Life Sciences And Social Sciences
ISBN: 9780134862620
14th Edition
Authors: Raymond Barnett, Michael Ziegler, Karl Byleen, Christopher Stocker
Question Posted:
