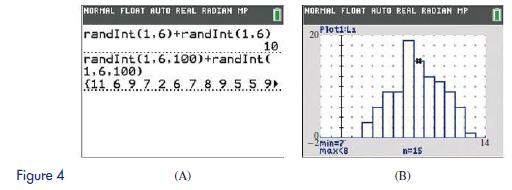
Use the graphing calculator output in Figure 4B to determine the empirical probabilities of the following events,
Question:
Use the graphing calculator output in Figure 4B to determine the empirical probabilities of the following events, and compare with the theoretical probabilities:
(A) E3 = a sum less than 4 turns up
(B) E4 = a sum of 12 turns up

Transcribed Image Text:
Figure 4 NORMAL FLOAT AUTO REAL RADIAN MP 0 randInt (1.6) +rand Int (1.6) 10 weg (1.6.100)+randInt( randInt 1.6.100) (11 6 9 7 2 6 7 8 9 5 5 9► (A) NORMAL FLOAT AUTO REAL RADIAN MP Ploti La 20 -2min=2 max
Fantastic news! We've Found the answer you've been seeking!
Step by Step Answer:
Answer rating: 0% (1 review)
A B 9 10...View the full answer

Answered By

Ajeet Singh
Hi there! Are you looking for a committed, reliable, and enthusiastic tutor? Well, teaching and learning are more of a second nature to me, having been raised by parents who are both teachers. I have done plenty of studying and lots of learning on many exciting and challenging topics. All these experiences have influenced my decision to take on the teaching role in various capacities. As a tutor, I am looking forward to getting to understand your needs and helping you achieve your academic goals. I'm highly flexible and contactable. I am available to work on short notice since I only prefer to work with very small and select groups of students. Areas of interest: Business, accounting, Project management, sociology, technology, computers, English, linguistics, media, philosophy, political science, statistics, data science, Excel, psychology, art, history, health education, gender studies, cultural studies, ethics, religion. I am also decent with math(s) & Programming. If you have a project you think I can take on, please feel welcome to invite me, and I'm going to check it out!
5.00+
4+ Reviews
24+ Question Solved
Related Book For 

Finite Mathematics For Business Economics Life Sciences And Social Sciences
ISBN: 9780134862620
14th Edition
Authors: Raymond Barnett, Michael Ziegler, Karl Byleen, Christopher Stocker
Question Posted:
Students also viewed these Mathematics questions
-
Under the conditions in Example 5, find the probabilities of the following events (each event refers to the sum of the dots facing up on both dice): (A) E 5 = a sum of 5 turns up (B) E 6 = a sum that...
-
Consider an experiment of rolling two dice. Figure 2 shows a convenient sample space that will enable us to answer many questions about interesting events. Let S be the set of all ordered pairs in...
-
Let us again consider rolling two dice, and assume that each simple event in the sample space shown in Figure 2 (page 398) is as likely as any other. Find the probabilities of the following events:...
-
The Wall Street Journal Corporate Perceptions Study 2011 surveyed readers and asked how each rated the quality of management and the reputation of the company for over 250 worldwide corporations....
-
At December 31, 2010, the trading securities for Natoli, Inc. are as follows. Instructions(a) Prepare the adjusting entry at December 31, 2010, to report the securities at fair value.(b) Show the...
-
Estimate the integral using a left-hand sum and a right-hand sum with the given value of n. fiv xdx, n=3
-
According to one estimate, more than half of the jobs created in India since 1991 have been in the informal sector. a. What is the informal sector? Why might businesses choose to operate in the...
-
Aurora, Colorado, passed an ordinance banning pit bulls and other selected breeds of dogs from being inside the city limits. The American Canine Foundation, an organization aimed at improving the...
-
16. Using the given data find value of resonance energy of benzene C6H6. AydgH of cyclohexene = -119 kJ/mole AhydgH of benzene = -206.5 kJ/mole (a) -150.5 kJ/mole (b) -325.5 kJ/mole (c) -87.5 kJ/mole...
-
Use output from the random number feature of a graphing calculator to simulate 100 rolls of two dice. Determine the empirical probabilities of the following events, and compare with the theoretical...
-
(A) What are the odds for rolling a sum of 8 in a single roll of two fair dice? (B) If you bet $5 that a sum of 8 will turn up, what should the house pay (plus returning your $5 bet) if a sum of 8...
-
Consider a small clinic staffed by one nurse who injects patients with an antifl u vaccine. The clinic has space for only four chairs. One chair is reserved for the patient being vaccinated. The...
-
In 2017, the Japanese company Takeda Pharmaceutical Company acquired the U.S. company ARIAD Pharmaceuticals at leader in oncology therapies for $5.2 billion. What economic advantages might the two...
-
Comment on the following statement: Middle East airlines have not been popular with the U.S. legacy carriers. This is because the Gulf airlines in the past have been heavily subsidized, with the...
-
A firms balance sheet shows the sources of finance (debt and equity) and how they have been used to acquire assets. If a firm has assets equal to 6.4 million and a debt ratio of 60%, how much debt...
-
On June 22, 2016, the day before the brexit vote, the British pound was worth $1.467. Two weeks later, on the July 7, the British pound was worth $1.292. a. By what percentage has the pound...
-
Suppose a firm earns $1 million before tax in Spain. It pays Spanish tax of $0.25 million and remits the remaining $0.75 million as a dividend to its U.S. parent. a. Under U.S. tax law prior to the...
-
A 2.00-kg rock is released from rest at a height of 20.0 m. Ignore air resistance and determine the kinetic energy, gravitational potential energy, and total mechanical energy at each of the...
-
Will the prediction interval always be wider than the estimation interval for the same value of the independent variable? Briefly explain.
-
Refer to Exercise 16.45. Estimate with 95% confidence the mean time spent watching or reading news on the Internet for the population of people who have completed 12 years of education. In exercise...
-
Refer to Exercise 16.46. Use a prediction interval with 90% confidence to predict the auction selling price of one Canada 1925 nickel with a grade of 40. Data from 16.46 Refer to Exercise 3.70 where...
-
A property owner has a property with a forecast net operating income of $100,000 for next year. A lender has indicated that he would make a loan on the property based on a 1.25 debt service coverage...
-
Through history, various economies have treated the use of interest as an unethical behavior. If explicitly charging interest were made illegal in the US, what are at least three (legal) mechanisms...
-
Record depreciation expense for the year 2023 in the governmental activities general journal at the government-wide level using the following information. You may enter your own description or use...

Study smarter with the SolutionInn App


